Case Studies
Case Study 3: Shopify Conversion Rate Optimization & UX Overhaul
Role: CRO lead across product page, cart, and checkout
Timeline: 6 months
Business: DTC Shopify brand
Category: Beauty (mid-priced consumer products)
AOV band: $40 to $90
Baseline context (confidential ranges):
Traffic volume: 50k to 150k sessions/month
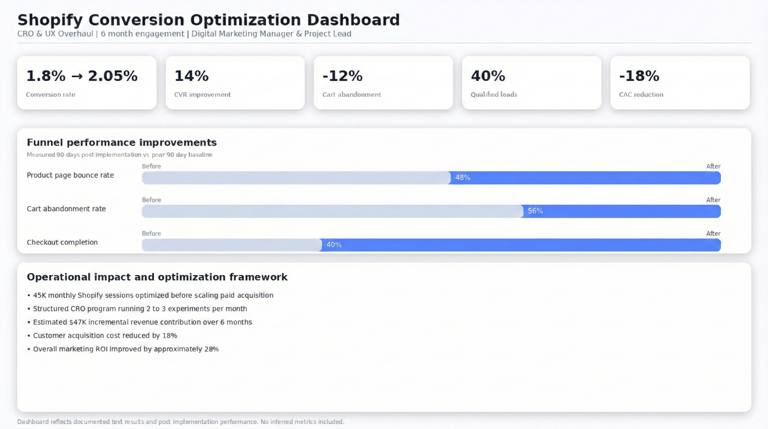
Conversion rate baseline: 1.8%
Primary acquisition: paid traffic growth (Meta/Google)
Challenge: Conversion stalled while traffic rose
Outcome: Higher CVR, lower cart abandonment, improved AOV and CAC efficiency, testing program established
Challenge
Traffic increased month over month from paid acquisition, but revenue did not scale proportionally.
Baseline funnel friction:
CVR plateaued at 1.8%
Cart abandonment elevated
PDP bounce and low engagement signaled unclear value and mobile friction
Scaling spend without conversion improvements would likely raise CAC and extend payback.
Approach
Phase 1: Diagnostic (weeks 1 to 2)
Funnel analysis in GA4 to identify top drop offs
Session recordings + heatmaps to observe behavior
Prioritized biggest leaks first: PDP → cart → checkout
Phase 2: Product page optimization (months 1 to 3)
CTA clarity and visibility on mobile
Trust signal placement near decision point
Image set improvements to reduce uncertainty
FAQ expansion to address repeated objections
Social proof delayed until review depth was sufficient
Phase 3: Cart optimization (months 2 to 4)
Clearer checkout progression cues
Tested free shipping threshold messaging
Avoided aggressive urgency after negative downstream signals appeared
Phase 4: Checkout simplification (months 3 to 5)
Removed non essential required fields
Added faster payment options where appropriate
Improved guest checkout flow
Phase 5: Recovery (months 4 to 6)
Exit intent used carefully and only where it did not suppress overall conversion
Recovery messaging emphasized help and confidence rather than constant discounting
Testing program
2 to 3 experiments per month across PDP, cart, checkout
Minimum test duration standards to reduce false winners
Results segmented by device to avoid desktop-only wins
Testing platform: Shoplift, supported by GA4 validation and device segmentation.
(When A/B tooling was not feasible, changes were validated through controlled pre/post comparisons with consistent traffic monitoring.)
Case Study 1: Lifecycle email and retention system (Beauty)
Role: Lifecycle and retention lead
Timeline: 4 months build, 6 months measured
Business: DTC eCommerce brand (Shopify + Klaviyo)
Category: Beauty (45 to 60 day repurchase cycle)
Baseline context (confidential ranges):
Monthly revenue: mid five figures
Email list size: 20k to 60k subscribers
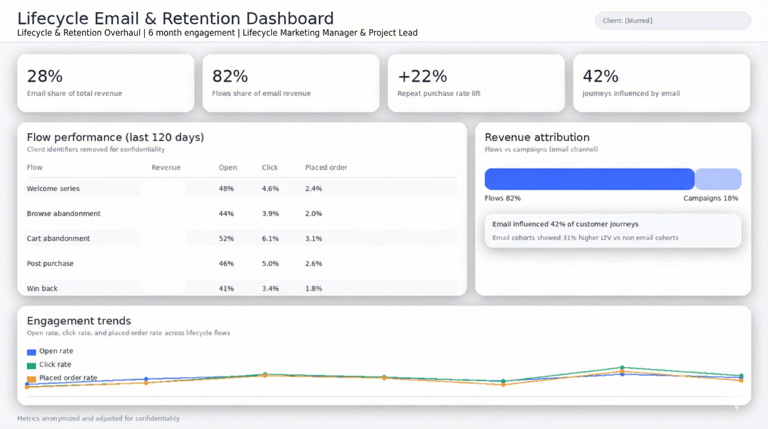
Email share of revenue: 8%
Email operation: manual campaign-led, 8 to 10 hours/week of execution
Challenge: Heavy reliance on manual campaigns, limited lifecycle coverage
Outcome: Email became a major revenue channel, repeat purchase improved, manual workload reduced, list health maintained.
Challenge
Email revenue relied on manual campaign sends and required 8 to 10 hours weekly to plan and execute. With minimal automation coverage, customers who did not convert during campaign windows received little structured follow up.
Business impact:
Many visitors abandoned browse or cart with no recovery attempt
First time buyers received limited post purchase nurture, leaving repeat purchase timing to chance
Retention performance lagged internal cohort expectations for similar AOV and traffic mix
Marketing bandwidth was consumed by tactical execution rather than strategic lifecycle growth
Approach
Strategic framework decision
After reviewing 6 months of journey data, I prioritized a 5-flow system rather than overbuilding an 8-flow setup. The goal was fast deployment of highest-impact automations, followed by iteration based on performance.
Flow build (Phase 1):
Cart abandonment (highest intent signal)
Welcome series (new subscriber conversion system)
Browse abandonment (high audience volume, lower intent)
Post purchase (aligned to beauty repurchase cycle: 45 to 60 days)
Win back (90+ day inactive customers with purchase history)
Segmentation strategy (maintainable, relevant)
Implemented a 3-tier segmentation model:
New customers (0 to 1 purchase): education + second purchase incentive testing
Active customers (2 to 4 purchases, under 90 days): cross sell and replenishment positioning
At-risk customers (90 to 180 days inactive): escalation testing (content-first → offer-based)
Product launch integration
Connected Shopify product tags to segments so flows could feature new releases without manual rebuilding. This created Day 1 coverage for launches and reduced coordination time.
Testing and measurement
A/B tests: one variable per flow per month (timing, content, or incentive)
Measurement stack: platform attribution + GA4 for assisted influence
Lifecycle reporting: defined once and reused consistently
Metric definitions
Flow conversion rate: placed order rate per flow recipient within 7 days of entering the flow
Email revenue share: platform last click for direct attribution (setup dependent)
Assisted influence: GA4 journey reports to reduce last click blind spots
Challenges and pivots
Month 2: browse abandonment targeting too broad
Browse triggers fired too early and captured casual browsers, diluting intent.
Fix
Raised trigger threshold
Added intent filters (more product views + meaningful dwell time)
Result: lower volume, higher quality audience and stronger conversion.
Month 3: post purchase content needed split paths
Repeat buyers disengaged because content felt repetitive.
Fix
Split post purchase flow:
First time buyers: education and confidence building
Repeat buyers: loyalty messaging, early access, relevant recommendations
Result: improved engagement and reduced unsubscribes.
Case Study 4: Supply Chain Optimization (Ops and marketing alignment)
Role: Ops and marketing alignment lead
Timeline: 8 months
Business: Multi SKU consumer products including regulated category products
Baseline context (confidential ranges):
SKU count: dozens of SKUs
Launch and promo cadence: consistent monthly schedule
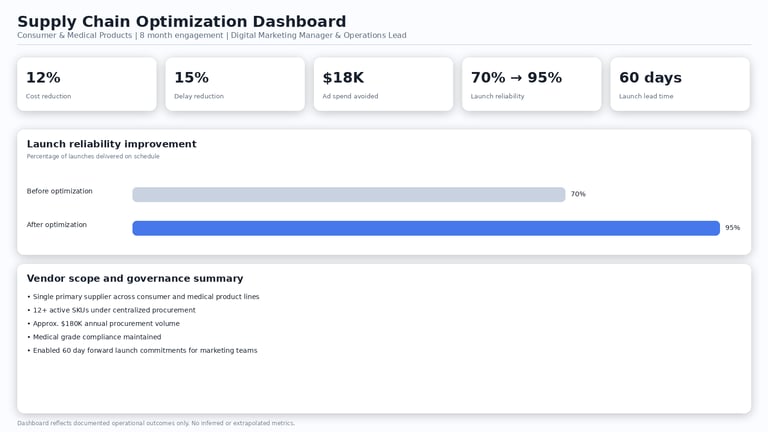
On time launch rate baseline: 70%
Vendor reliability baseline: 75% to 85% on-time (key suppliers)
Challenge: Launch delays and stockouts repeatedly disrupted marketing execution
Outcome: Higher on-time performance, fewer stockouts during campaigns, improved planning reliability
Challenge
Launches missed dates and marketing sometimes went live without inventory, creating wasted spend and internal trust erosion.
Operational impact:
Launches slipped by weeks
Lead times varied widely, making planning fragile
Stockouts forced campaign pauses and created customer service burden
Unit cost focus hid the real cost of delays and missed launch windows
Approach
Phase 1: diagnostic and vendor performance analysis
Reviewed historical orders to identify delay drivers
Built vendor scorecard weighted toward reliability and communication, not just unit cost
Phase 2: calendar integration
Built shared launch calendar
Worked backward from launch date to PO placement deadlines
Added safety buffers sized to delay risk and validated through pilot launches
Phase 3: accountability and escalation
Weekly supplier status cadence
Yellow/red thresholds for delays
Backup supplier relationship as insurance for critical launches
Phase 4: economics translation
Shifted model to total cost of ownership:
delay cost
lost launch value
wasted campaign spend tied to stockouts
Reframed buffers as controlled carrying cost rather than “excess inventory.”
Challenges and pivots
Procurement resistance to buffers solved through carrying cost vs launch failure math
Supplier pushback reduced using fair caps and clear exemption rules
A near miss validated the backup strategy and improved internal adoption
Case Study 2: Amazon FBA marketplace launch (Home & Kitchen)
Role: Marketplace launch lead
Timeline: 8 months
Business: Amazon US + Canada launch from zero presence
Category: Home & Kitchen
Baseline context (confidential ranges):
Starting position: 0 reviews, 0 sales history
Working capital: low five figures (inventory + ads combined)
Efficiency requirement: ACoS needed to remain under 25%
Operating constraint: avoid inventory risk and account health issues
Challenge: No reviews, limited capital, strict efficiency requirement
Outcome: Revenue ramp with stable ad efficiency, review growth, repeatable launch framework
Challenge
Launching into Home & Kitchen meant competing against established sellers with strong review moats and competitive auctions.
Starting constraints:
Zero reviews and no sales history
First time implementing FBA logistics + cross border setup
Strict efficiency requirement to protect contribution margin
Core challenge: build conversion and credibility fast without overspending and without inventory mistakes that could stall the launch.
Approach
Phase 1: Listing foundation (months 1–2)
Keyword research + competitive mapping using marketplace research tools
Listing built around differentiation and clarity, not price cutting
Image set aligned to category norms (clean hero + benefits + lifestyle)
A+ content created after Brand Registry access
Phase 2: Review velocity strategy (months 2–3)
Decision tradeoff: Vine vs slower organic-only approach.
Decision
Used Amazon Vine for select parent ASINs where margins supported it, then shifted to organic review growth through product experience and compliant follow up.
Phase 3: Advertising system (months 3–6)
Sequenced testing to prevent early budget waste:
Exact match on small set of core terms with tight budgets
Search term mining + negatives
Phrase expansion only after conversion stability
Competitor/category targeting after social proof improved
Phase 4: Cross border logistics + inventory risk (ongoing)
Buffers accounting for customs time and fee differences
Inventory alerts at 30 day + 15 day
No ad scaling without inventory coverage
Challenges and pivots
Month 2: early overspend caused by auto targeting
Fix: paused auto targeting, mined search term reports, rebuilt exact match first. Stabilized ACoS after negatives and bid controls.
Month 4: supplier delay near miss
Fix: expedited replenishment options and temporarily reduced ad intensity to protect inventory coverage. Implemented stronger buffer policy.
Month 6: Canada market size reality
Fix: right sized Canada to best sellers and freed capital for US growth while maintaining presence.


Results (6 months measured)
Email share of revenue: 8% → 25% to 30% within 120 days
Flows share of email revenue: became majority post launch (55% to 80%, depending on promo calendar)
Repeat purchase rate: improved 15% to 25% relative over 6 months
Manual workload: reduced 8 to 10 hours/week
Incremental proof point: by month 4, flows generated consistent monthly revenue in the five-figure range, reducing reliance on manual campaigns.
List health (unsubscribe impact):
Unsubscribe rate remained stable or improved (0.15% to 0.30% per send, depending on promo intensity)
After browse tightening and post purchase split paths, unsubscribes decreased 10% to 20% relative while maintaining conversion
Recommendations
Monthly lifecycle QA checklist (links, segmentation, offers, suppression rules)
Add SMS only where it improves outcomes (cart + win back), avoid list fatigue
Track first purchase cohorts monthly to validate retention trend
Add extra flows only if data supports it (VIP, replenishment, refund prevention)
Tools: Klaviyo, Shopify, GA4, session recordings + heatmaps, Asana
Results (month 8)
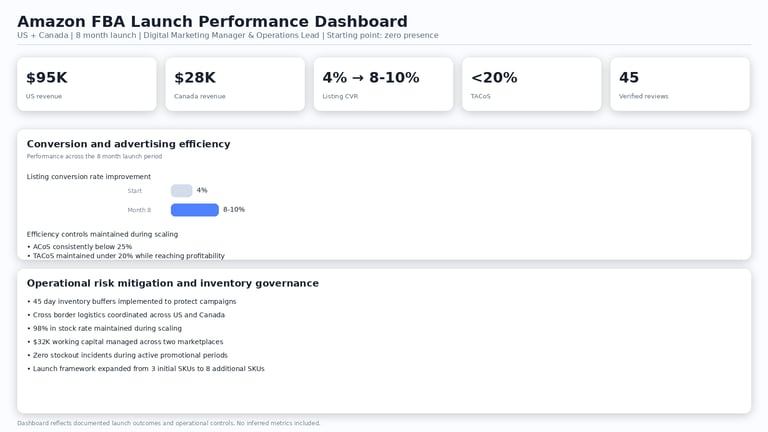
US revenue: reached low to mid five figures monthly run rate by month 8
Canada revenue: reached low four figures, then right sized
ACoS: stabilized in the low to mid 20% range after early corrections
TACoS: TACoS stabilized in the low to mid teens (approx. 12% to 16%)
In stock rate: stayed high with no major stockouts during planned promos
Review progression: priority listings moved from 0 → 25 to 60 reviews in the first 3 to 5 months using compliant programs, then grew organically to 80 to 150+ reviews on best sellers by month 8.
Recommendations
Expand into Sponsored Brands only after review depth + conversion stabilize
Weekly keyword hygiene routine (search term mining, negatives, reallocation)
Tie inventory forecasting to ad scaling rules
Keep Canada focused on top SKUs unless margin and velocity justify expansion
Tools: Seller Central, Amazon Ads Console, marketplace research tools, Google Sheets dashboards, Asana
Results
CVR: 1.8% → 2.05% (about 14% relative lift)
Cart abandonment:Cart abandonment decreased by 8 percentage points (68% → 60%), representing 12% relative improvement
Mobile CVR: improved meaningfully after mobile-specific fixes
AOV: increased 3% to 8% due to improved value framing and threshold messaging
CAC: decreased 5% to 12% due to improved conversion efficiency
Incremental revenue method:
Lift applied to actual sessions and AOV over the measurement window, excluding traffic growth effects where possible.
Recommendations
Build a 12 month CRO roadmap (PDP, cart, checkout, landing pages)
Device-specific reporting as standard (mobile vs desktop)
Strengthen proof assets (reviews, UGC, comparisons) before scaling spend
Quarterly speed checks to prevent performance regression
Tools: GA4, session recordings + heatmaps, Shopify theme edits, Shoplift, Asana, Sheets
Results
On time launch rate: improved from 70% → 90% to 95%
Vendor on time performance: improved from 75% to 85% → 90% to 95% for key suppliers after scorecards and cadence were implemented
Stockouts during planned campaigns: reduced 40% to 70% after coverage rules, buffer sizing, and readiness controls
Planning horizon: moved from weeks-forward to 6 to 8 weeks forward visibility
Waste reduction: avoided recurring campaign waste tied to out-of-stock launches
Measurement notes
Launch readiness tracked via inventory-confirmed status before marketing go-live
Vendor scorecard reviewed monthly (on-time %, defects, response time)
Compliance note
Compliance requirements remained intact through existing quality processes while planning and vendor management systems were rebuilt.
Recommendations
Monthly vendor scorecard review (on time %, defect %, response time)
Launch readiness checklist (inventory confirmed before marketing goes live)
SKU coverage rules (minimum days on hand by category)
Keep backup supplier option for top revenue SKUs only
Tools: Asana launch calendar, Google Sheets scorecards, Slack alerts, supplier status process, dashboards for leadership visibility